Category Value Report: Revenue Intelligence Platforms

Steven Forth is CEO of Ibbaka. Connect on LinkedIn
Ibbaka uses its value model generation AI to get insights into value at the category level. We generate value models for key vendors in a category and then combine these to get a holistic view of value in the category.
These category value reports are used by:
Buyers to select the vendor that best matches their requirements
Users to understand best practices in implementing these systems
Vendors to understand their positioning, their Ideal customer profile, and how they deliver value to customers
The Category Value Report for Revenue Intelligence Platforms is the third in this series.
Download the Category Value Report: Revenue Intelligence Platforms here
Download the Category Value Report: Internal Talent Market Places & Skills Management here
The Category Value Report for Revenue Intelligence Platforms is generated from the value models for the following vendors.
Note that generic value models were used. These are value models generated from public information, they do not rely on any internal or proprietary data. The value models could be improved by using proprietary data, which is done as part of an Ibbaka subscription. Generic value models are important, though, as they show what the value of a solution looks like from the outside.
Summary of the Category Value Report on Revenue Intelligence Platforms
The report analyzes how leading Revenue Intelligence Platforms (RIPs) create value by mapping vendor solutions to key business metrics and value drivers for different organizational roles.
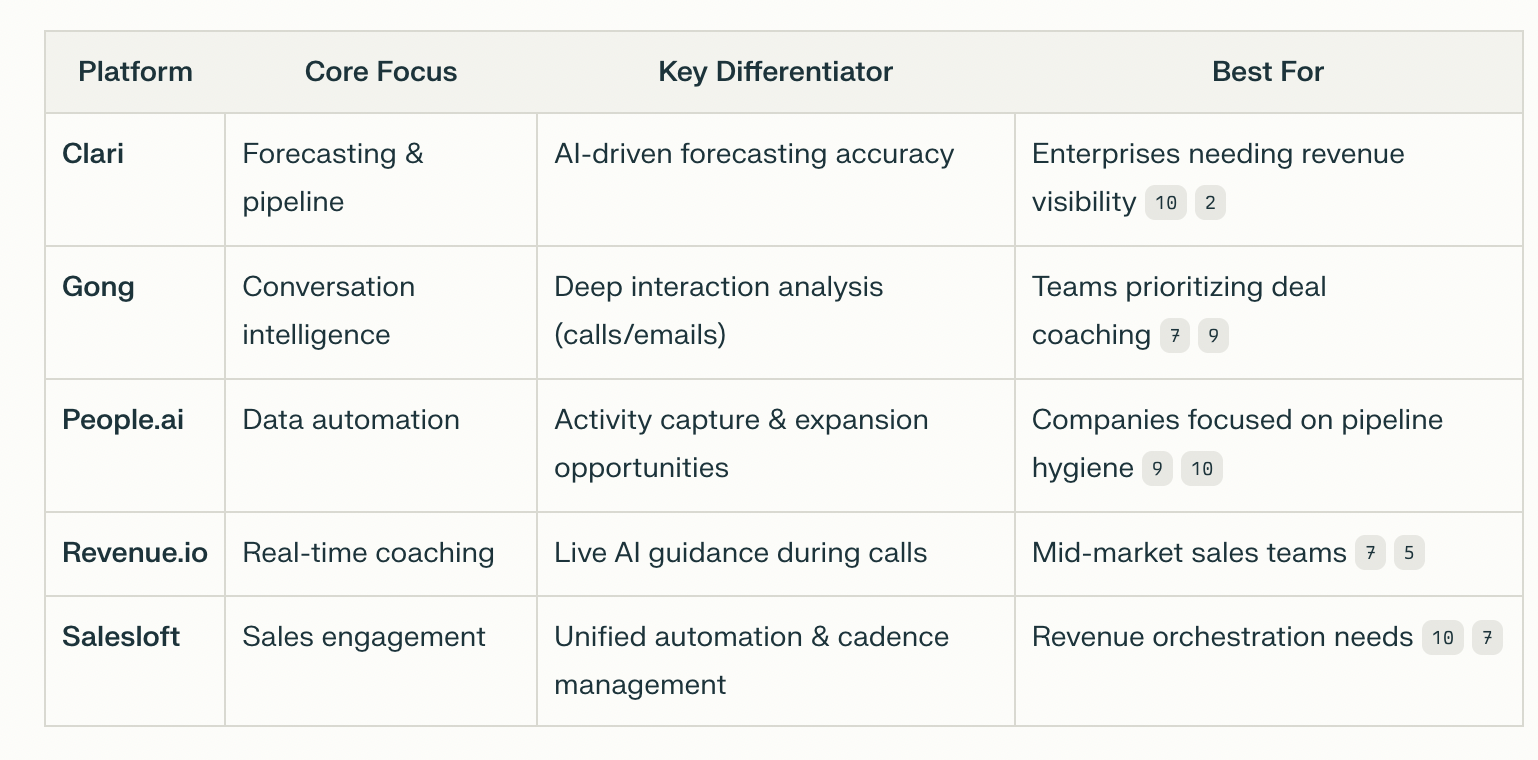
Vendors covered: Clari, Gong.io, People.ai, Revenue.io, and Salesloft. Each offers unique strengths in pipeline management, conversation intelligence, activity capture, real-time coaching, and sales engagement automation.
Core problems that RIPs address:
Misalignment between sales, marketing, and customer success
Missed buying signals
Ineffective sales coaching
Slow adaptation to market changes
How RIPs create value:
Automate data capture and unify customer interaction data
Use AI analytics for risk/opportunity detection and predictive forecasting
Provide real-time dashboards and actionable insights1
Key value drivers:
Revenue enhancement (win rates, deal size, revenue leakage reduction)
Cost reduction (onboarding time, admin burden, tech spend)
Risk reduction (forecast accuracy, compliance, agility)1
Metrics impacted:
For CROs: revenue growth, forecast accuracy, win rates, sales cycles
For users: win rates, admin time, deal size, coaching effectiveness
Market trend: Vendors are converging features, blurring lines between forecasting, conversation, and pipeline intelligence, creating a unified Revenue Operations & Intelligence landscape.
Design Structure Matrix of Value Drivers for Revenue Intelligence Platforms
A design structure matrix (DSM) is a technique for understanding dependencies and clusters. This DSM was generated from the value drivers for the RIP category. A value driver is an equation that estimates the impact of a solution or part of a solution. As an equation, it has variables. The DSM shows which equations share variables and therefore tend to vary together. A cell with a ‘4’ in it means that the two equations share four variables. We then use our AI to find clusters of strongly related value drivers.
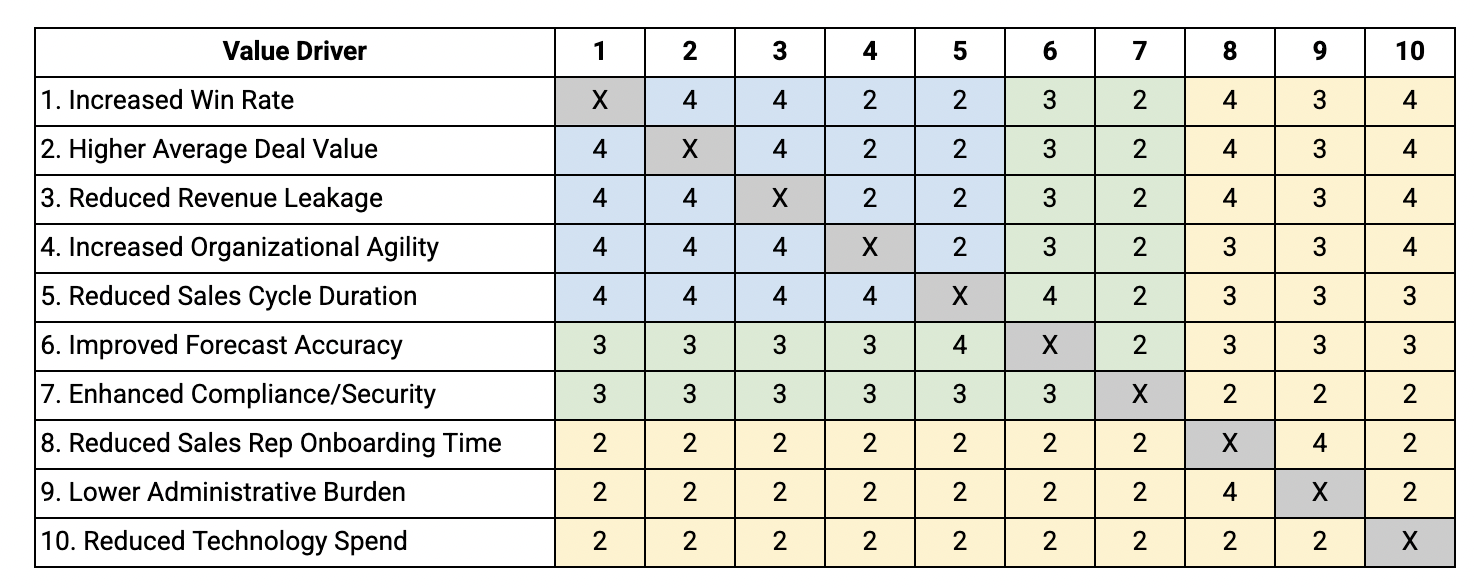
Design Structure Matrix for Value Drivers in the Ibbaka Category Value Report for Revenue Intelligence Platforms, generated May 15, 2025.
Three clusters were found. In most cases, we find four or five clusters. The relatively low number for the RIP vertical reflects convergence in the market.
Cluster 1: Revenue Enhancement Drivers (1-5)
These value drivers share numerous variables, particularly Annual Revenue and Gross Profit Margin
The high degree of interconnection (mostly 4 shared variables) indicates these drivers are highly complementary
All focus on directly increasing revenue through different mechanisms (win rates, deal size, leakage prevention, cycle time)
Cluster 2: Risk Management & Planning Drivers (6-7)
These value drivers form a bridge between revenue enhancement and operational efficiency
They share moderate connections with revenue drivers (3 shared variables), but also connect to operational drivers
Focus on improving predictability and reducing organizational risk
Cluster 3: Operational Efficiency Drivers (8-10)
These value drivers form a distinct cluster focused on internal efficiency
Reduced Onboarding Time and Lower Administrative Burden are particularly tightly connected (4 shared variables)
They represent cost savings rather than direct revenue enhancement
Prompts to summarize the report
Many people today use generative AI to read reports like this. To support this, we have prepared three prompts and included them in the report: one for buyers, one for users, and one for vendors. You will want to customize these prompts with information about your situation, but here are the generic responses from Perplexity (you can see the prompt in the link or get it in the report).
Summary for potential buyers
The report provides a Category Value Map outlining how leading revenue intelligence platforms (RIPs) create value and impact key business metrics for roles like CRO, Sales, RevOps, and Finance.
Key vendors analyzed: Clari, Gong.io, People.ai, Revenue.io, and Salesloft, each with distinct strengths in pipeline management, conversation intelligence, automation, and engagement.
Revenue intelligence platforms address critical challenges: manual data entry, team misalignment, missed customer signals, ineffective coaching, and slow market response.
Core value drivers include revenue enhancement (win rate, deal size), cost reduction (onboarding, admin burden), risk reduction (forecast accuracy, compliance), and increased organizational agility.
The platforms are evaluated across these value drivers, showing which solutions best align with specific business outcomes and roles.
The report emphasizes the importance of mapping platform capabilities to your company’s goals and metrics for maximum impact.

Summary for users
Integrate Broadly: Ensure the platform is connected to your CRM, email, calendar, and call systems for comprehensive data capture.
Adopt Data-Driven Coaching: Use the platform’s analytics to identify skill gaps, replicate top performer behaviors, and provide timely feedback.
Monitor Key Metrics: Track win rates, sales cycle duration, forecast accuracy, and pipeline health using platform dashboards.
Leverage Predictive Insights: Act on AI-driven deal risk alerts and opportunity signals to prioritize high-impact actions.
Streamline Onboarding: Use recorded calls and AI insights to create onboarding playbooks, reducing ramp time for new hires.
Foster Cross-Team Alignment: Share insights with marketing, customer success, and finance to ensure unified revenue operations.
Continuously Improve: Regularly review platform usage, update playbooks, and adjust processes based on insights and outcomes.
Summary for vendors
Positioning & Value Drivers
If your platform specializes in AI forecasting: Compare to Clari’s end-to-end visibility, but emphasize ease of use or cost efficiency.
If focused on conversation analytics: Highlight gaps in Gong’s pipeline management or privacy concerns.
Key value drivers to enhance:
Revenue Enhancement: Improve win-rate algorithms or cross-sell insights.
Operational Efficiency: Streamline CRM integrations or reduce onboarding complexity.
Ideal Customer Profile (ICP)
Target companies with:
Industry: SaaS, FinTech, or sectors with complex sales cycles.
Size: Mid-market to enterprises ($50M–$500M revenue).
Growth Motion: Sales-led growth (SLG) requiring pipeline rigor.
Tech Stack: CRM users (Salesforce, HubSpot) needing deeper analytics.
Competitive Differentiation Strategies
Enhance AI/ML models for predictive accuracy (e.g., Clari’s forecasting vs. Gong’s conversation trends).
Expand integrations with IoT/blockchain for real-time data synergy.
Prioritize usability: Reduce learning curves (noted as a Clari drawback).
Develop industry-specific modules (e.g., healthcare compliance analytics).
Conclusions
Revenue Intelligence Platforms are necessary for any company with a sales-led growth motion. They are also useful for product-led growth companies as they can be used to organize and understand multi-channel feedback.
This is one of the key areas where generative AI is being used to increase value.
☝️Join the valueIQ waitlist to embed value intelligence in your sales conversations.☝️
Navigating the new pricing environment brought by AI agents? Contact us @ info@ibbaka.com
