In pricing it is the distribution that matters (averages are not your friend)


Steven Forth is a Managing Partner at Ibbaka (currently on leave). See his Skill Profile on Ibbaka Talent.
Working in pricing one sees a lot of talk about averages: average price, average contract value, average discount, average user, average buyer, average usage …
Pricing actions based on average values are almost always bad decisions. Why is that?
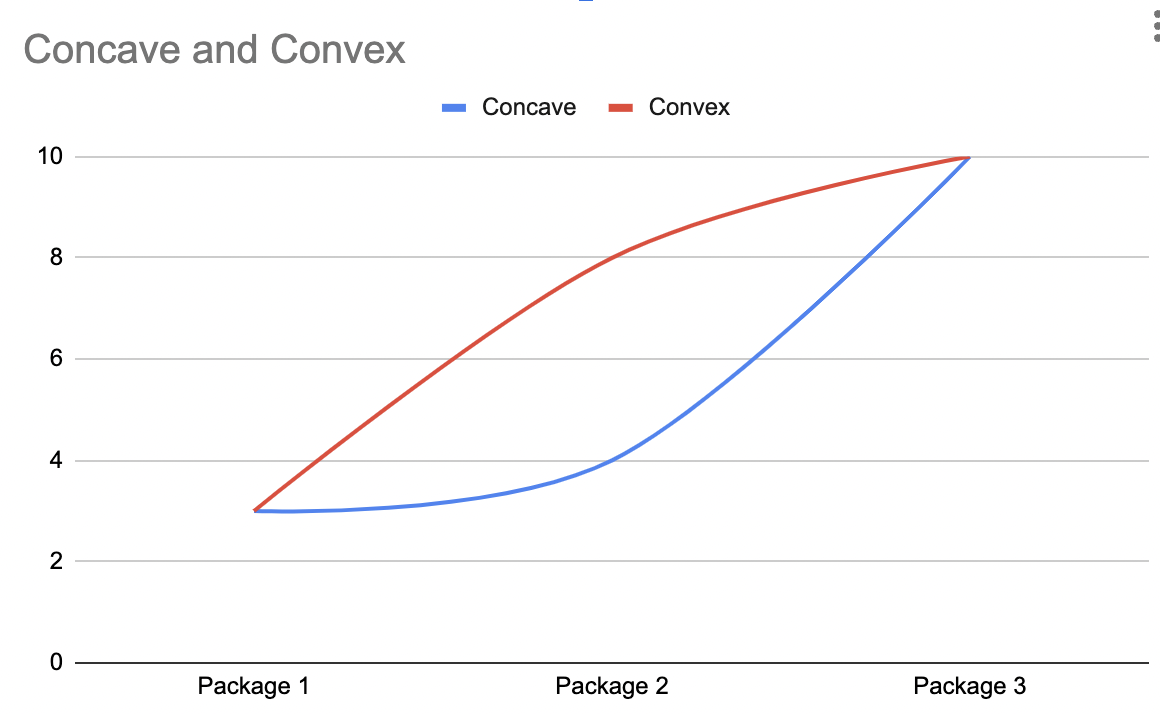
Pricing, skewness and distributions - concave or convex pricing
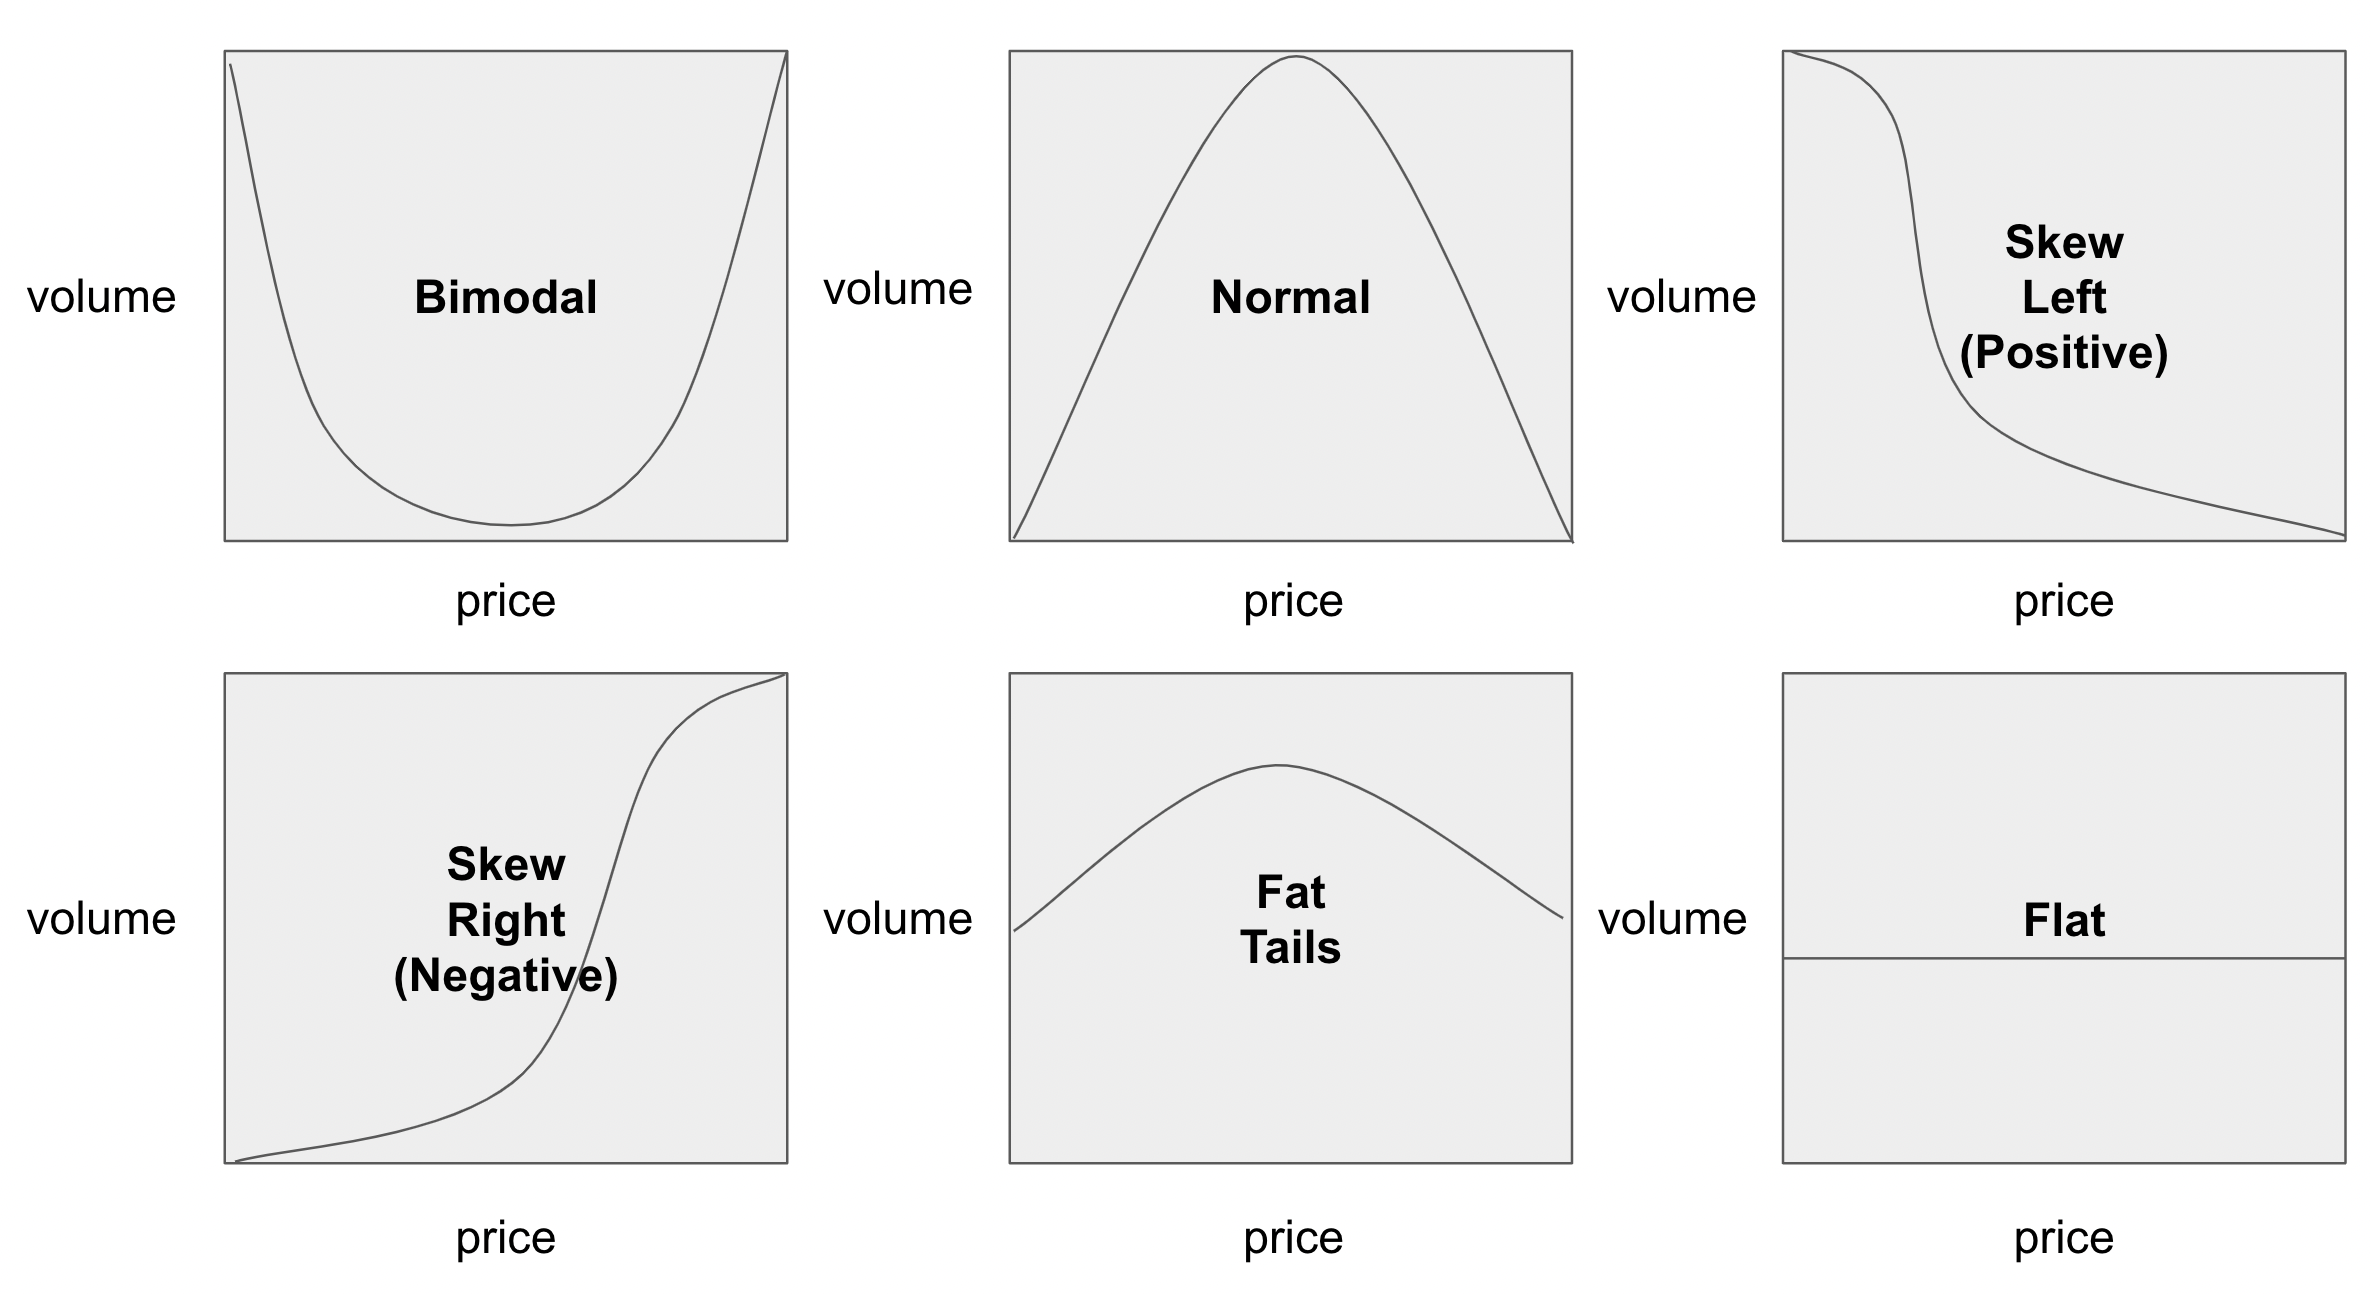
The ‘average’ obscures a lot of important important information that you need to design pricing. Take the following two distributions, which could easily have the same average.

Would you have the same pricing strategy for these two distributions? Of course not.
The bimodal distribution suggests that you need two different packages with two very different price points. The ‘normal’ distribution, which one almost never sees in actual data, suggests one package, a base price, and a well design scaling metic, possibly based on usage.
Here is another example. Most pricing distributions skew to the right or the left. Would the same pricing curve make sense for these different distributions? Again no.

The distribution that skews left calls for a concave pricing curve. The distribution that skews right will be optimized with a convex pricing curve.
One of the first things to do when analyzing SaaS pricing is to look at the price x volume distribution and then look at the pricing curve. Sometimes the pricing curve is found in the prices of the different Good, Better, Best packages. In other cases it is harder to see as it is buried in the volume discounting model. Understanding the interplay of distributions and pricing curves is an important skill for the SaaS pricer.
In fact, there is a whole family of curves, and each one implies a different pricing design.
When one gathers pricing and usage data, or information on discounting, one wants to look a lot deeper than just the average. One starts with the three most common measures: the mean, median and mode. One can infer quite a bit about the distribution from these three numbers.

The next thing to look at is the standard deviation. This is a measure of the variation around the mean. Knowing the size of one standard deviation and how many data points are within it is a good way to get a feel for how pricing is working.
When I first started working on SaaS pricing I was quite surprised to see that the value of one standard deviation is often much larger than the average price. If you think about it though, this is to be expected in SaaS companies selling to the enterprise, where some large deals can skew the distribution to the left (positive skew). Only design volume discounts after you understand the volume distributions.
In addition to mean, median, mode and the standard distribution some other measures of a distribution that can come in handy are skewness and kurtosis. The NIST has a. good site explaining these measures of a distribution and how to calculate them.
As we saw above, skew is a measure of the lack of symmetry in a distribution.
Kurtosis is a measure of how fat the tails are (or of how pointy the peak is). Distributions with high kurtosis are most often found in product led growth, where pricing discipline is built in and a narrow market is being served in the same way.
Simpson’s Paradox, Segmentation and Pricing
One of the most interesting phenomena around trends and averages is what is known as Simpson’s Paradox.
This comes up quite often in pricing data. It is one reason that clustering pricing data is so important. In Simpson’s Paradox one can simultaneously have correlations going in two different directions in the same data set. The above animation shows how this is possible. When this happens in pricing data (and you should always check) you need a different strategy for each of the clusters. Pricing for the overall trend line will lead to perverse results.
We saw this once with a SaaS vendor where a focus on the overall trend had caused them to misprice virtually every customer and leave tens of millions of dollars on the table. By redesigning the pricing to respect the clusters in the data, and the trends in the clusters, we were able to uncover 3X more revenue.
Some simple rules for working with pricing data and distributions
Do not rely on averages, look at the distribution, ask if it is
Bimodal (or multimodal) - if it is you need a package for each peak
Skewed left - use concave pricing
Skewed right - use convex pricing
Has fat tails (or is completely flat) - invest in a good approach to volume scaling (see Pricing and sales volume)
The standard deviation is larger than the average - you will need enterprise pricing for large deals
Look for clusters in the data and make sure you are not a victim of Simpson’s Paradox
When there are clear clusters you may need a different pricing design for each cluster, especially if the overall trends or distribution differ from the cluster trends or distributions
Optimize price for the distributions and clusters in the data
Don’t fall for Simpson’s paradox, price for the trend in the cluster and not the overall trend
Match the pricing curve to the distribution to optimize for … volume or revenue or profit (you cannot optimize for all three at one)
Pricing excellence is buried in the details. SaaS pricing requires its own approaches to data analysis and tools. Generic approaches from manufacturing or even on prem software will not serve.
