A new take on SaaS metrics and pricing


Steven Forth is a Managing Partner at Ibbaka. See his Skill Profile on Ibbaka Talio.
Last week at SaaStr Europa Kyle Poyar from OpenView proposed a new set of SaaS metrics (June 7 in London). Metrics are at the heart of the SaaS business. They are how we measure and tune the performance of our business model. At Ibbaka, one of the first things we do is help companies identify the key metric they are planning to improve with better pricing. The most common candidates are
Recurring Revenue (Monthly or Annual - MRR or ARR)
Average Contract Value (ACV)
Net Revenue Retention (NRR or NDR for Net Dollar Retention)
Lifetime Value of a Customer (LTV)
Retention or its inverse Churn
Customer Acquisition Costs (CAC)
We can also get involved in improving pipeline metrics.
Opportunity generation
Conversion rates
Pipeline velocity
Where do these metrics come from?
A lot of these metrics came from the telecommunications industry and were initially applied to mobile phone subscriptions. The canonical source in the SaaS business is SaaS Metrics 2.0 – A Guide to Measuring and Improving what Matters from David Skok. If you have not read or reread this recently you may want to pause and do so now.
Kyle has shared his ideas on the next generation of SaaS metrics in two posts.
SaaS Metrics 2.0: The Case For Next Era Metrics Playbook on OpenView
Your guide to SaaS Metrics 2.0 on his Growth Unhinged Substack
Let’s look a little deeper into why we need to change our approach to SaaS metrics.
What is motivating a new approach to SaaS metrics?
There are a number of limitations to the standard SaaS metrics. They are well suited to a sales led growth motion, with a single pricing metric, that is applied to a time-based subscription.
This is not the world most SaaS companies live in today.
Most companies now combine two or more growth motions (and they do not always lead with sales led growth).
Hybrid pricing metrics have been shown to drive faster revenue growth and provide more resilience than single factor pricing.
SaaS package design has matured as companies move towards more articulated designs such as Good Better Best (GBB), platform with extensions, or structured product menus.
Business pressure is leading SaaS companies to exploit more and more revenue streams.
With these changes have come a greater focus on Customer Experience (CX) and User Experience (UX). CX and UX have a big impact on how products are distributed to market, how people have adopted them to make them part of their work, and how value and use lead to expanded revenues.
Growth motion
Sales led growth remains the most common approach, according to Ibbaka research it is the leading motion for about 70% of SaaS companies, but other motions are growing in importance.
Of these, the one getting the most attention is product led growth or PLG and it is the emergence of PLG as a central growth motion (and investment hypotheses) that has led Kyle to propose a new set of metrics.
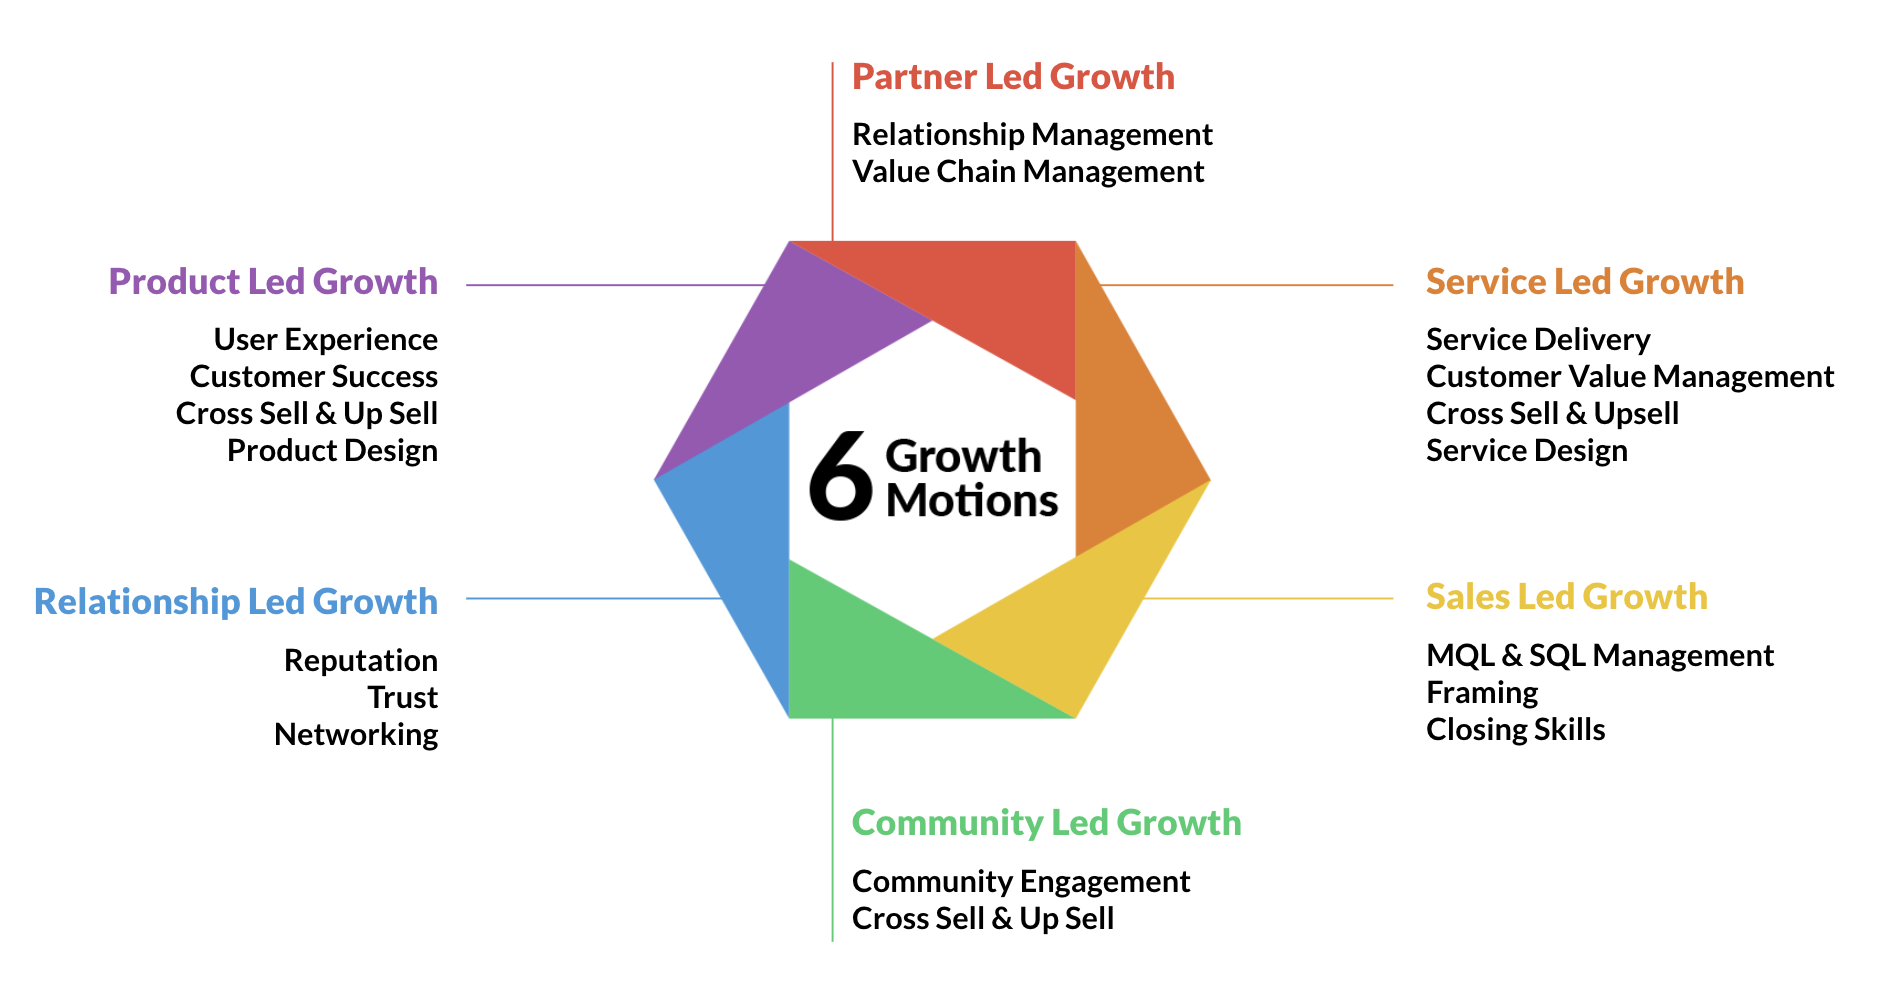
Most SaaS companies combine two growth motions. The most common combinations are product led growth and sales led growth, product led growth and community led growth and sales led growth and partner led growth.
A new generation of SaaS metrics and pricing designs will need to support combined growth motions.
Pricing metric
The conventional SaaS metrics work best with single factor pricing. We know from work by Zuora and others that this is not the revenue growth optimizing design. Many companies are moving to hybrid pricing models (this was one of Kyle and my predictions for 2023) as they provide better opportunities to align price to value, more flexibility in a turbulent environment and generally more robust growth.
Offer architectures (SaaS Packaging Patterns)

Part of SaaS maturation is the emergence of a common set of packaging patterns. The simple One Big Package pattern is being complemented with many other patterns that enable better value delivery and value capture. Tiered or GBB packaging (Good Better Best) is popular at the moment but there are many options. SaaS metrics are going to have to track all of these packaging patterns and help us understand which pattern works best in different circumstances.
Revenue streams
The conventional SaaS metrics are focussed on the subscription revenue stream. Most SaaS companies have additional revenue streams that they are trying to leverage. The obsession with subscription revenues (and the tendency of VCs to value a company based on a multiple of its forward subscription revenues) was really a belief that these revenues are predictable and high margin. Any revenue stream with these two properties is attractive and relevant to valuation.
Some of the revenue streams that SaaS metrics will need to measure (and help to predict) are …
Transactions (as these become predictable)
Generation (as generative AI absorbs more and more business processes)
Data services (as they become key to AI)
Professional services (to the extent these are high margin and predictable)
Outcomes (as AI leads us towards outcome-based pricing)
One of the key questions to ask will be around revenue expansion opportunities. Net Revenue Retention is driven by six factors and revenue models that address all six will often generate the highest NRR.
Positive factors
Grow in package
Upsell
Cross sell
Negative factors
Churn
Shrinkage in package
Downsell
See Prioritizing NDR growth choices for more detail.
CX and UX

Product Led Growth has led to a lot more focus on the full customer and user lifecycle. There is growing use of journey maps and a focus on usage metrics. These metrics help predict future revenue and key inputs into revenue prediction.
The emerging best practices is to use usage metrics to predict future revenue.
Some benchmarking from Kyle Poyar
In his SaaStr talk, Kyle shared some important benchmarks for sales led growth and product led growth companies. These provide context for his proposal for new metrics.

On NDR, Ibbaka is working with PeakSpan to gather more granular insights on how NDR relates to growth model, packaging pattern, category and organizational structure. You can contribute here.
The key point here is that companies with usage-based pricing can achieve eye popping levels of NDR growth. In fact, Snowflake had close to 170% NDR at IPO and as of April 30, 2023 was still at 151%.
When NDR is greater than 100% one has to change how one calculates LTV (more on that in another post).

Product Led Growth companies have different growth patterns than Sales Led Growth companies. They are more dependent on SEO, they leverage the product, word of mouth and viral adoption more effectively, and are dependent on some combination of free trial and freemium to drive initial consideration and adoption. NDR numbers, as shown by Snowflake, can drive the growth engine and lead to high valuations.
Proposed SaaS metrics for PLG
Given the importance of users to SaaS growth, SaaS metrics should pay more attention to user metrics across the user journey.
This is expected to remain true even as procurement becomes more involved in SaaS. See SaaS grows up (and gets grown up pricing problems). Business buyers, procurement and the users themselves will demand that only software that is used get renewed (and renewals are key to NDR). With well designed pricing, software that gets used more will drive more revenue.

In the new approach to SaaS metrics, leaders will steer their companies (and investors will evaluate them) on metrics that cover each stage of the customer journey.
Discover
New website vistors
Community members (added by Ibbaka)
Lead generation by source/channel
Start
Conversion from unique website (and other channels) visitor to lead
Activate
New activations of the software (including freemium and free trial)
Cost per activation (as a more accurate metric than Customer Acquisition Costs)
Convert
Cohorted (segmented) free-to-paid conversions
Product-influenced revenue (key to service led growth motions)
Sticky users (second order activations, upsells, conversions from free to paid)
Scale
Northstar usage metric (the metric that most correlates with value delivered)
Cohorted (segmented) gross and net revenue retention
Product Qualified Accounts (more than just Product Qualified Leads as insights from the product drive business growth beyond just the sale)
Value to Customer (V2C) is the Missing Metric
There is something missing in all this. These new metrics are meant to get us more focussed on the customer and the user and to track how user interactions drive revenue growth. But most of us do not use software in order to generate a lot of clicks or usage data. We use software because we get value and companies buy software because they get value. The foundational metric is value delivered to the customer.
Delivering value to customer (V2C) is the foundation to growing a SaaS business. If you are not measuring this you will not be able to execute on a long term growth strategy.
One way to connect usage to value is to measure value path completion rather than raw usage. A value path is a series of actions a user takes that concludes with something of value. Tracking value path completion is the first step to connecting use to value.
SaaS pricing is increasingly model driven. The foundational model is the value model, a system of equations that estimates the impact you have on your customer’s business. The pricing model, another system of equations, can be derived from the value model.
The future of SaaS metrics should include the value our users and buyers are getting from the software we provide them and the communities and data built around our solutions.
