Pricing AI assistants for productivity suites: Survey Results
Steven Forth is a Managing Partner at Ibbaka. See his Skill Profile on Ibbaka Talio.
There has been a lot of interest and comment on Microsoft’s decision to price its Open.ai powered Generative AI Copilot for MS365 at US$30 per month. This was at the high end of what people were expecting and is high relative to typical MS365 subscriptions, in fact it is more than most subscribers currently pay. Markets responded well to this, sending Microsoft’s stock price up. There are some that are saying Microsoft’s future growth depends on the success of Copilot and its pricing. Google is expected to have some form of competitive response in the near future.
How do users see Copilot pricing? To get some insight into this, Ibbaka launched its own small Van Westendorp study last week. Rather than asking about Copilot specifically, we asked about generative AI assistants for productivity suites.
A Van Westendorp study asks four questions about price.
Imagine an AI assistant that can generate and analyse spreadsheets (including macros), presentations (including graphics), written content of all types and videos. It can work with MS Office applications or Google Workplace or OpenOffice. The price is per month.
priced so low that you would feel the quality couldn’t be very good?
a bargain—a great buy for the money?
starting to get expensive, so that it is not out of the question, but you would have to give some thought to buying it?
so expensive that you would not consider buying it?
There are follow up questions asking how likely one would be to buy at the ‘bargain’ and ‘starting to get expensive’ prices. This is used to estimate probable purchases and to find a revenue optimizing price.
Open.ai did a Van Westendorp survey for ChatGPT. It was distributed through OPen.ai’s Discord server, and seems to have been used to set the price at US$20 per user per month. See What pricing metric for ChatGPT Plus?
Note that people have two reference points they will use to frame Copilot pricing, the price of a MS 365 subscription and the price of a ChatGPT description.
We also asked some questions to gauge overall attitudes to AI: whether the person would recommend using AI for work and their general attitude towards AI.
This survey is limited in that it represents (i) people in the Ibbaka network and not the larger population and (ii) people interested in AI who were more likely to respond. We got 249 responses in the week the survey was open. It was mostly promoted through LinkedIn.
Before jumping in to the pricing results, let’s look at attitudes towards AI. Given that this is the Ibbaka network, I thought people would be generally accepting of AI based solutions.
How likely are you to recommend the use of AI based assistants?
Hmm, more negative than I had expected.
What is your general attitude towards AI?
Wow, even more negative, though there were relatively more prompters.
I guess I live in a bit of a bubble, as I am well over in the green. Later we will see if attitudes towards AI impacts price acceptance.
Price level acceptance for generative AI powered assistants like Microsoft Copilot
Let’s look at what the data says about buyer acceptance at different price levels.
The red line is the responses to ‘priced too low’ question.
The yellow line is the answer to the ‘a bargain at this price’ question.
The green line is the answer to the ‘starting to get expensive’ question.
And the blue line is the answer to the ‘too expensive to buy’ question.
The three ovals circle the three places at which one might choose to set the price. These are the prices where one runs in to pricing walls, where many people’s perception of the price changes.
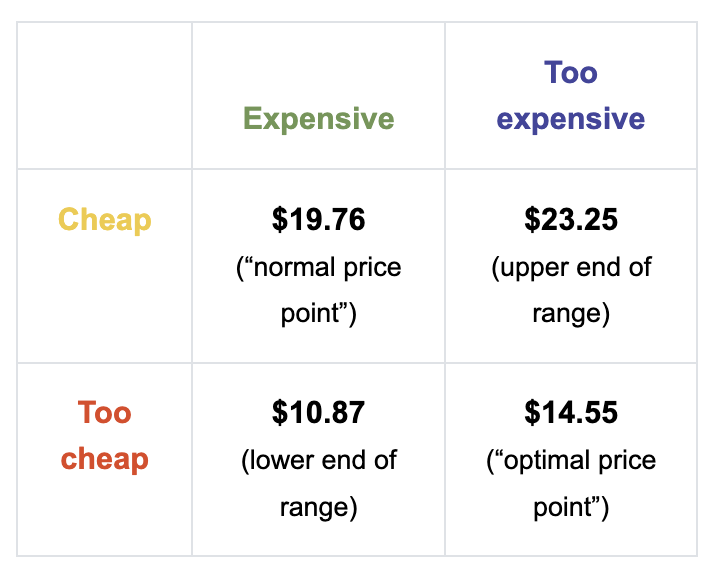
Conventionally one gets the following analysis (it is based on the intersections of the different curves).
Van Westendorp analysis suggests that the optimal price point is where the ‘too’ cheap’ and ‘too expensive’ lines cross. The normal price point is where cheap and expensive cross. We all know this is much too simple, that price setting is about a lot more than where these lines intersect, but it is worth noting that Microsoft decided on a price that is 2X the optimal price point and almost 1.5X the normal price point. Why is that?
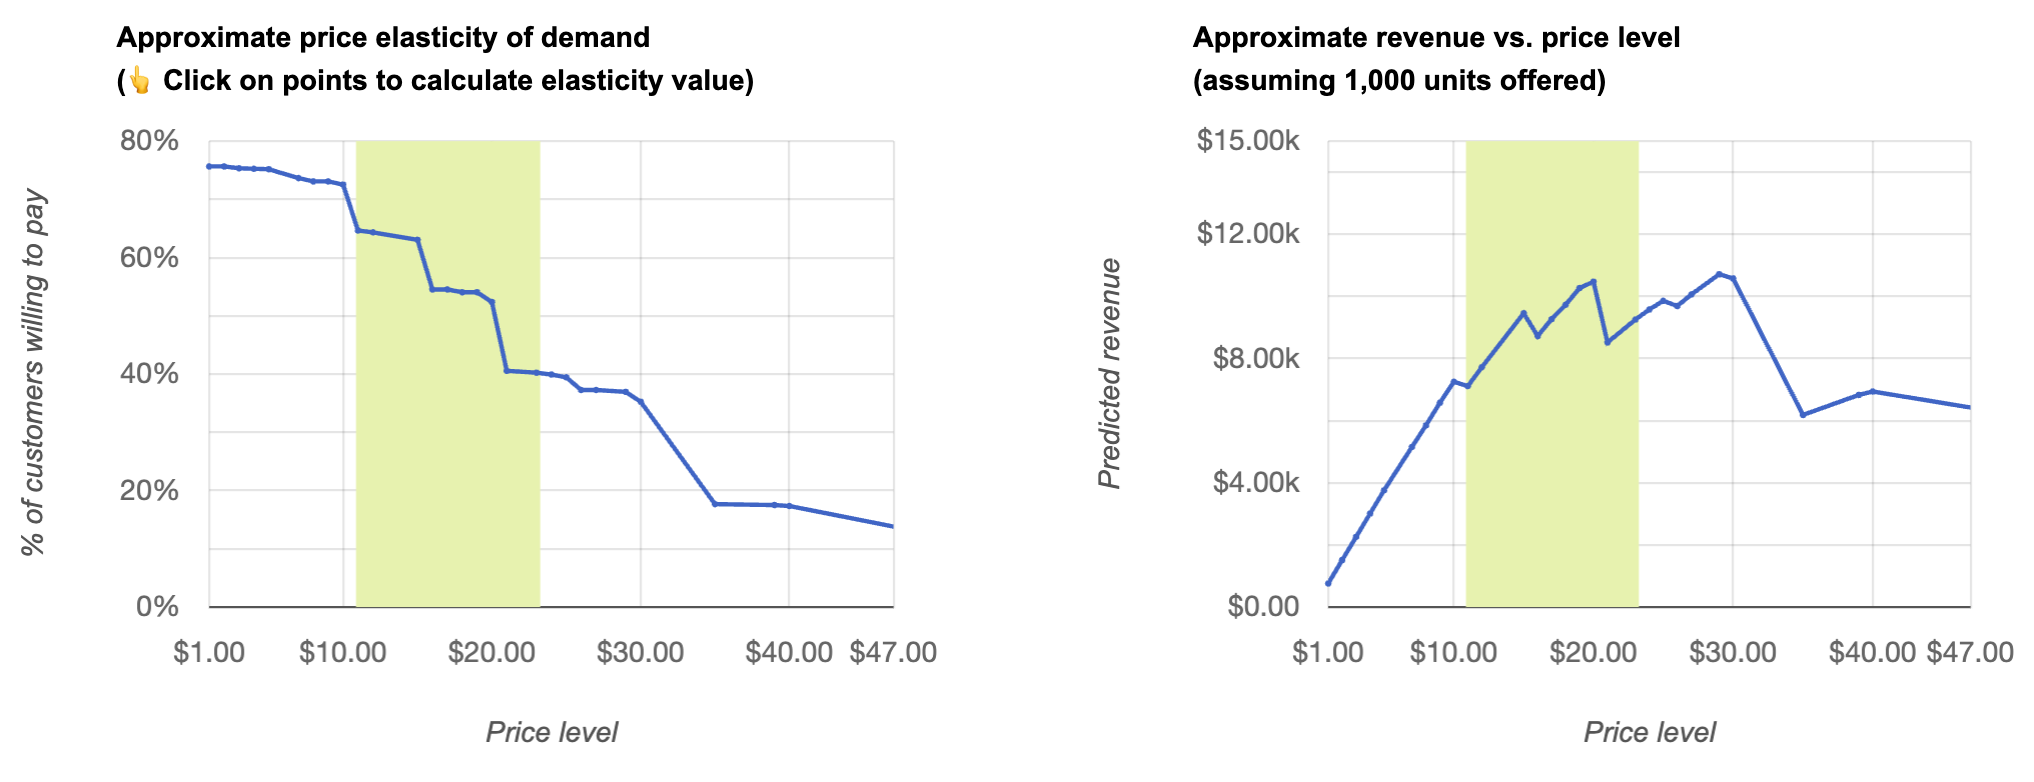
One reason has to do with revenue optimization. The revenue optimizing price from this data is $29 per user, with $30 per user coming a close second. The ‘normal’ price was third. If Microsoft’s goal is to optimize for revenue rather than adoption they seem to have made the right decision.
Segmenting pricing by role, geography and Microsoft vs. Google
Segmentation by Role
Before we comment further, let’s look at some segmentations.
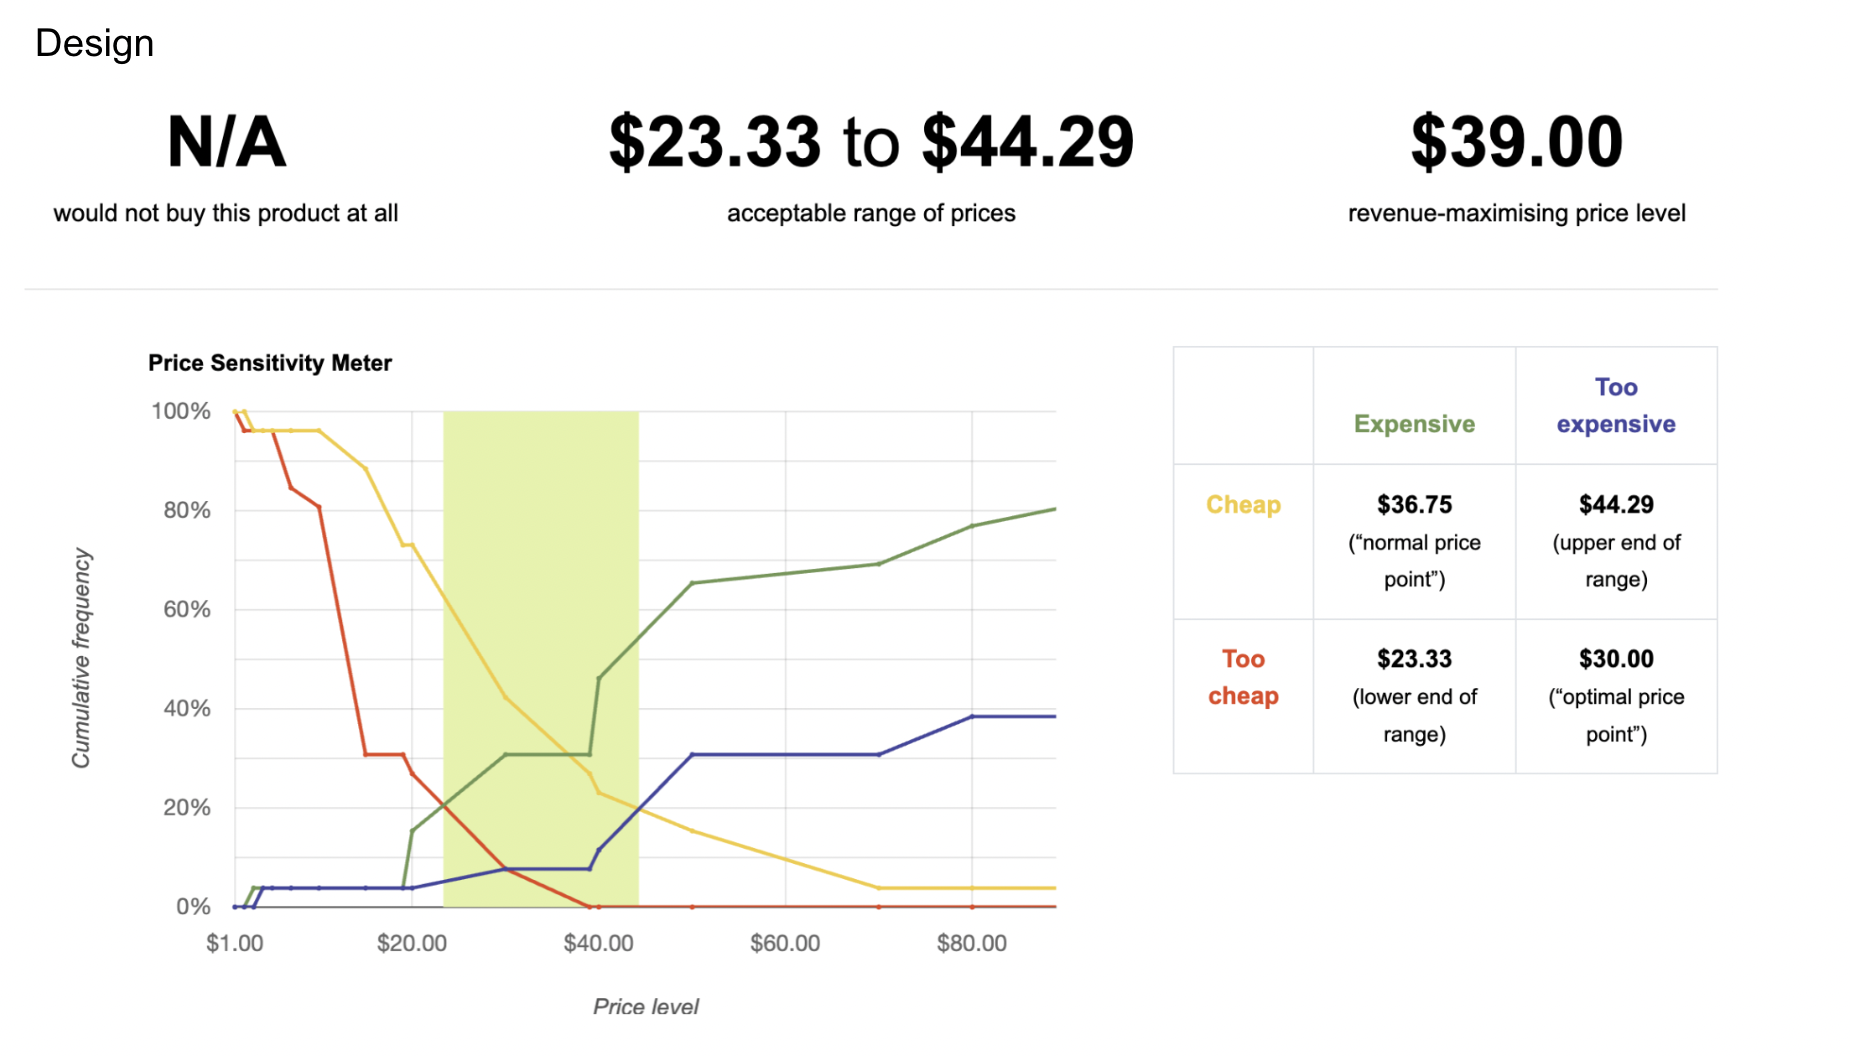
Three of the most common roles are ‘technical’ at 14.9% of respondents, ‘design’ at 10.4% of respondents and ‘Business Consultants’ at 8.8% of respondents. As these are the roles that have seen the most disruption and potential benefit from generative AI let’s compare them.
Let’s see if these attitudes are reflected in price acceptance.
Designers would accept a higher price than technical people or business consultants. Is this because designers are the most threatened? Or is there selection bias here as many of the respondents are members of the Design Thinking group on LinkedIn (managed by Ibbaka) where generative AI has been a hot topic of discussion.
The differences between business consultants and technical people are much smaller. and the price optimizing price is the same.
It would be interesting to do deeper research into how people in different roles see the value and threat of AI in their work lives.
Europe vs. North America
There are many other ways to cut the data and to look for pricing opportunities. Pricing acceptance of generative AI may be different between Europe (N = 63) and North America (N = 155) (the only two geographies where we have enough responses to segment). Let’s look at general attitudes to AI and compare price acceptance.
Detractors are about the same in the two geographies, but supporters are twice as common in North America. Will this impact price acceptance?
Marginally. The acceptable price range reaches higher in North America, suggesting that the actual pricing of US$30 per user will be better accepted in North America. In both geographies the revenue optimizing price was $29.
MS 365 vs. Google Workspace
And now for the big question. Are there differences between Microsoft 365 and Google Workspace? (We asked about Open Office, but only 2% of people said this was their productivity suite.)
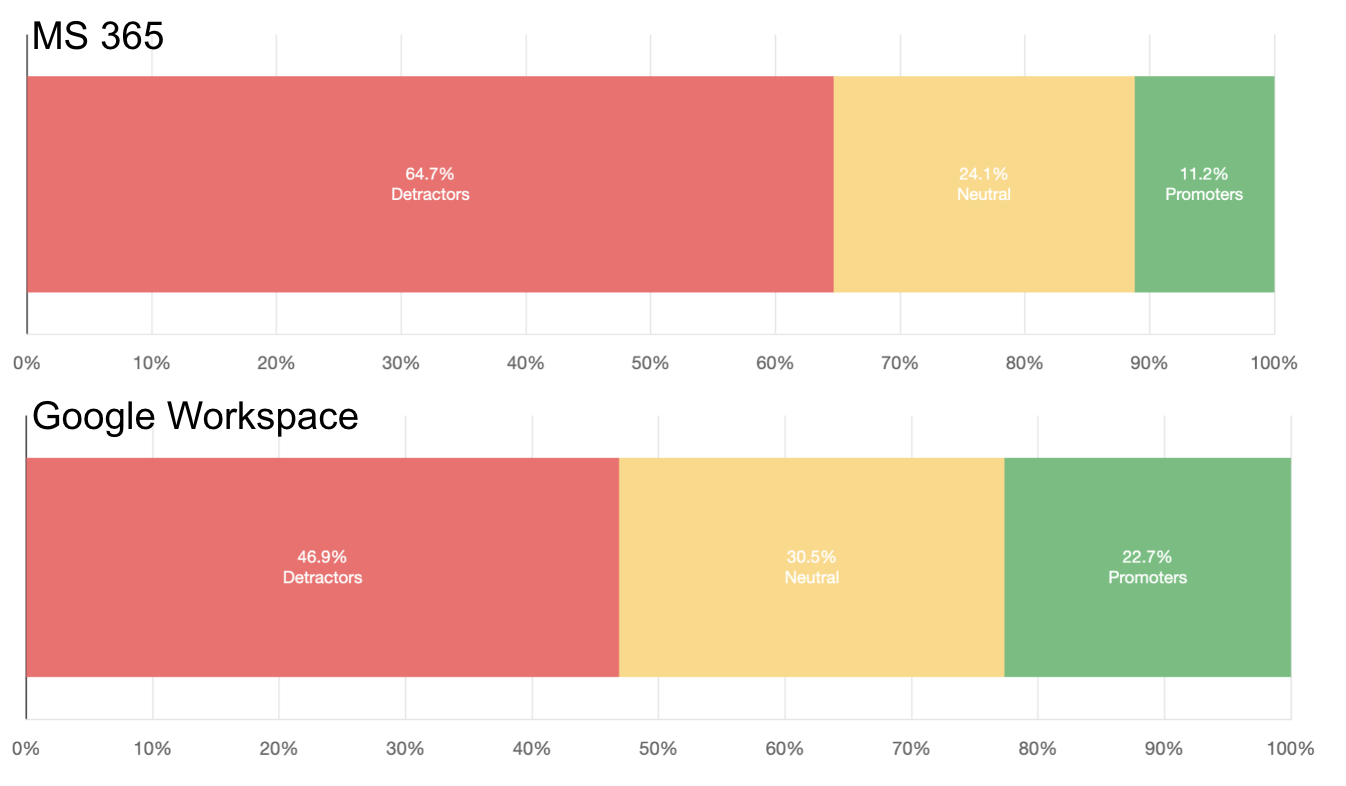
We begin again with an attitude to AI.
Google uses seem to be significantly more open to AI, but will this translate into higher price acceptance?
Price acceptance is higher for Google, the light green band shifts to the right, but the revenue optimizing price is a bit lower.
Did Microsoft make a good pricing decision?
Based on this data, Microsoft made a reasonable pricing decision.
They priced near the revenue optimization price (and the stock market has rewarded them for this)
They have a broad based application with a huge installed base, they don’t need to price for market penetration
They wanted to establish a reasonable but not excessive anchor for Copilot, as it will become a reference point for many other pricing decisions
What will Google do?
Assuming that their model is competitive and they do as good a job on integration as Microsoft (both open questions), Google could price higher than Microsoft and get the same level of acceptance. I suspect they will choose to price under $30 though. They will probably price in the $20-25 range and use a lower price as a way to win market share from Microsoft. It will be interesting to see how this gets played over several rounds of innovation and pricing.
Individual patterns in price acceptance
It is fascinating to look at the actual individual responses, which show some common patterns. Here are five patterns that show up again and again in Van Westendorp studies.
The first is the sceptic. The software we used forces people to enter four numbers and each number has to be higher than its predecessor. Some people enter $1, $2, $3, $4. These tend to be people highly sceptical of the value of this sort of AI.
The things to look for when examining these curves is
the slope of the line, which determines the range of prices the person considered, and
the shape of the curve, concave or convex.
There are four different response curves with different implications for pricing.
Narrow Range (the red curve): the price response changes with only small changes in price. It is easy to misprice and there is a great deal of price sensitivity. The lower the slope the more price resistance and the more careful you need to be about pricing too high.
Wide Range (the yellow curve): the price response is stretched over a wide range of prices. This is a more forgiving market and one can afford to be more aggressive in pricing. The steeper the slope the more aggressive you can be about pricing.
Concave Curve (the green curve): If you are executing on a premium pricing strategy (like Microsoft seems to be with Copilot) you can afford to be more aggressive and push on the upper boundary.
Convex Curve (the orange curve): price resistance is moderate up to a threshold and then goes quickly from being expensive to too expensive. If you are executing a premium strategy you need to be cautious at the top end of the price range.
Of course a curve has a slope and a shape, so in the real world you are looking a scenarios that combine the two.
Microsoft is not the only company pricing generative AI at a premium
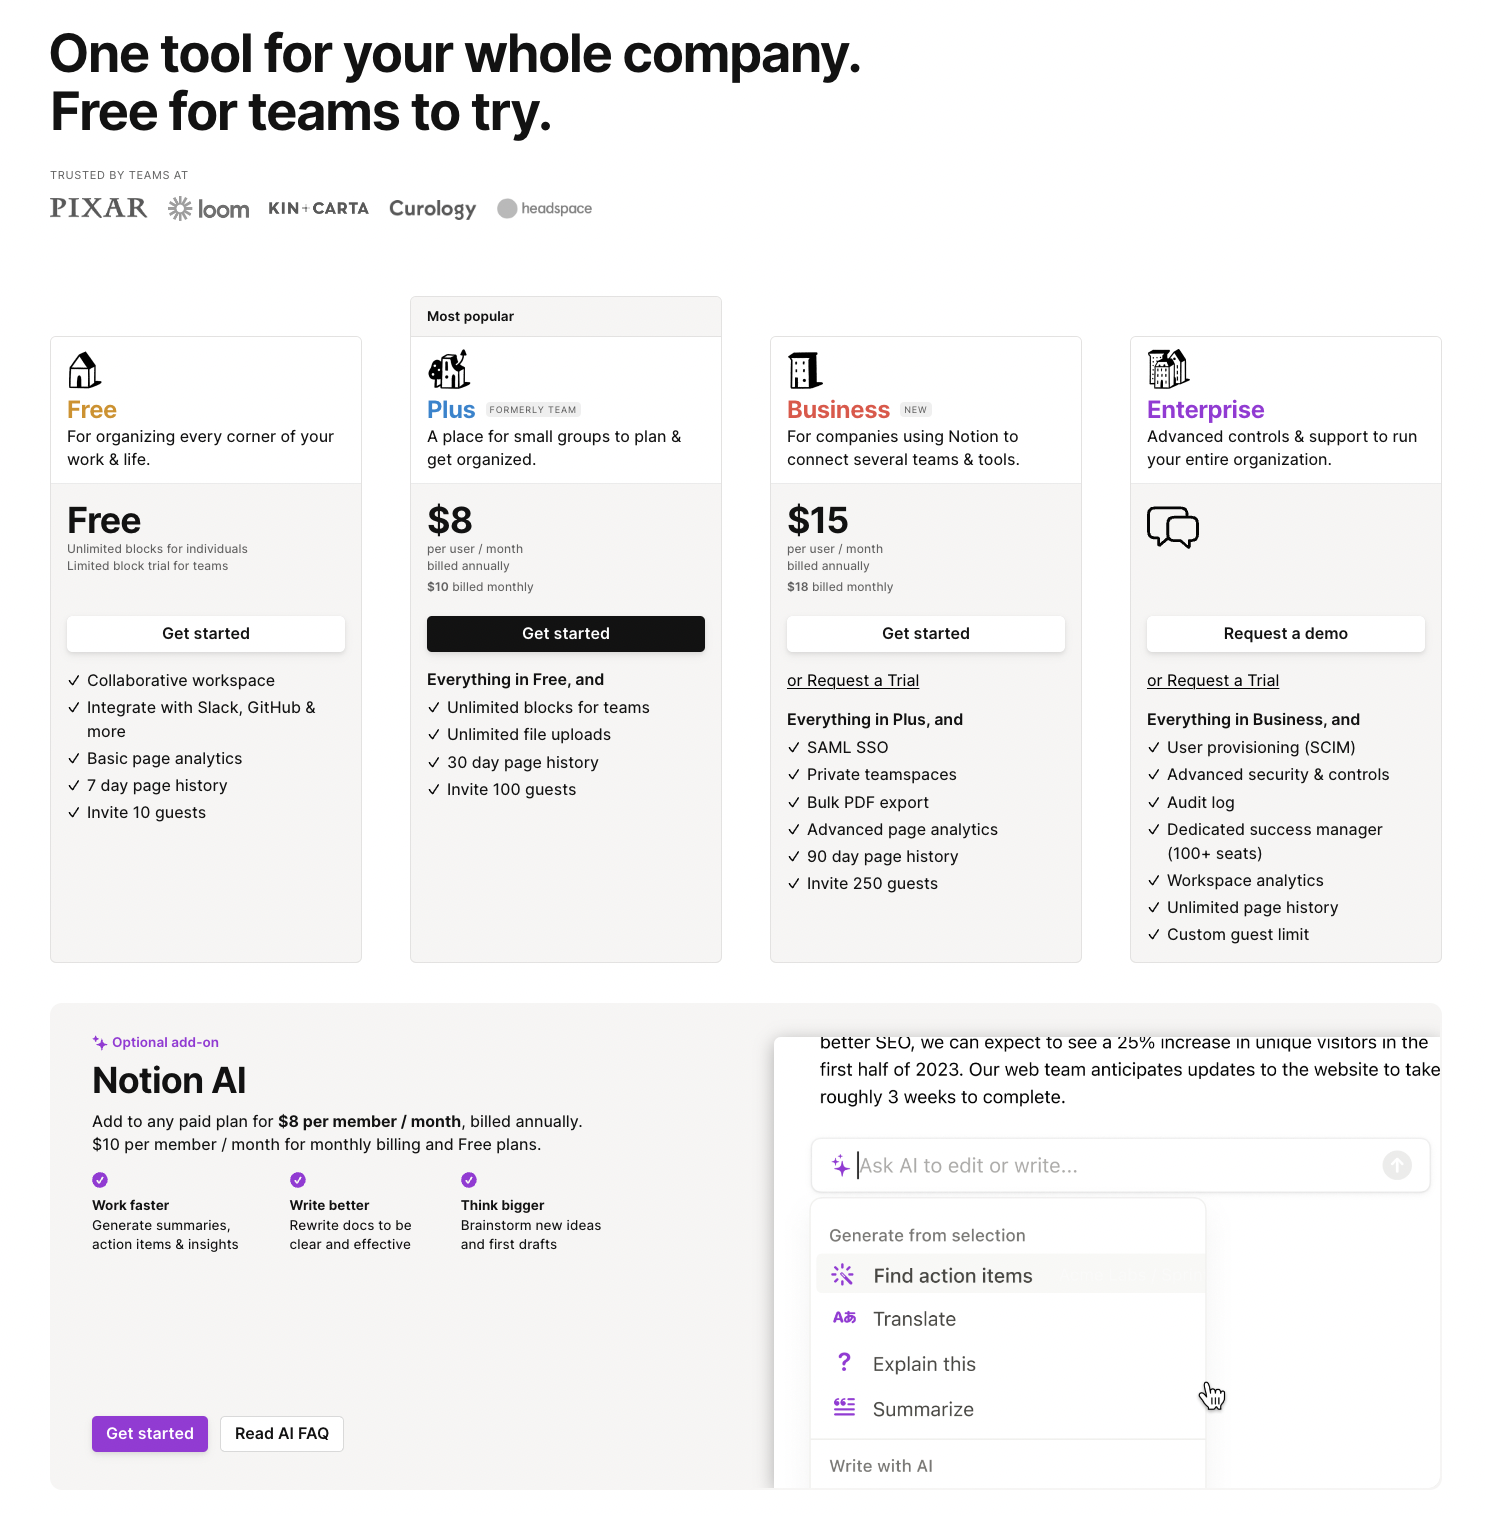
For comparison, let’s look at another application that has layered in AI functionality. Notion is a popular connected work platform combining wikis and document management with project management. It has recently launched Notion AI, which it positions as a teammate able to automate routine work and free up your time to focus on your human teammates and the brainstorming new ideas.
Here is Notion’s pricing page.
Notion AI is priced at $10 per user per month, more expensive than the basic Plus package.
A pattern is emerging in which AI is being packaged as its own module and priced at a premium to the basic offering. The goal is to position the AI module as something valuable in its own right and not just as an extension of existing functionality. Beyond this, prices are being set above that of the basic functionality.
It would be interesting to see the value model for these AIs and compare them to the value model for the existing applications. Are the value drivers the same in each case or is the AI providing new value drivers?


