In pricing analysis the shape of the distribution matters


By Steven Forth
Pricing work generally involves the gathering and analysis of a lot of data. There will be a lot of numbers to gather, analyze and understand, but numeric data alone will not give the insights needed to drive pricing design. Some of that data will be in the form of words and images.
This is something we are already seeing in the Skills for Pricing Experts survey that we are currently running in cooperation with the skill management platform TeamFit. (Please click on the above link and take the survey if you have not already done so.)
The shape of the distribution matters
Having reviewed many cases of data analysis over the years, one thing I have noticed is that many analysts, myself included, often pay too much attention to the details of the numbers rather than focusing on the overall shape of the data set and the trends buried in it. Back at Monitor Group, we referred to this as being precisely wrong, rather than being directionally correct. In pricing, especially in pricing strategy and design, it is the overall shapes of the curves and the directional trends that give the most insight.
Let's look at a simple example. Imagine we have identified two market segments and the willingness to pay (WTP) in each segment averages 8 dollars in both segments. In one segment the median WTP is 7 dollars and in the other it is 9 dollars. Is the same pricing strategy appropriate for both segments? Probably not. The segment where the median is higher than the average skews right and the segment where the median is lower than the average skews left.


This simple comparison of median and average is something we should do automatically whenever anyone presents us with an average. Never assume there is a normal distribution (a Bell curve).

In a segment where the distribution skews right, there are more people with a higher than average WTP. The goal of pricing and marketing strategy should be to serve these people, and (very simplistically) the price should be the median WTP and not the average (I am sure we have all seen pricing strategies that default to the average WTP). Where the distribution skews left, the average WTP is often a good place to start with price setting. Of course this is too simple, and depending on the exact shape of the curve will not even optimize revenue. In most cases, pricing should optimize for profit rather than revenue. This makes careful analysis of the distribution even more important, as small price changes generally impact profit more than revenue.
Try making a simple scatter plot of any piece of numeric data you are you using. This data could be a price distribution, various data from your sales funnel like conversion rates or time in any part of the pipeline, or survey data you have been collecting. What is the shape of the distribution? What does that shape tell?
The search for differentiation
In pricing work we are often searching for differentiation. The Economic Value Estimation process is designed to uncover the differentiated economic value of an offer relative to the next best competitive alternative. Market segmentation is meant to find the combinations of segmentation axes (the dimensions along which customers are defined so that they can be grouped into segments) that brings different segments into sharp focus and shows how they are differentiated. One of the easiest ways to do this is to look at the shape of the distributions.
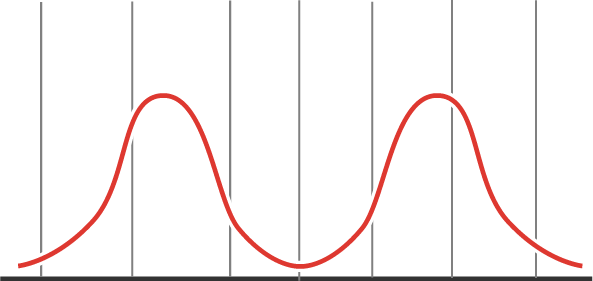
Whenever you see a bimodal distribution (fondly known as a two-humped camel) you have good evidence of differentiation. When this shows up clearly in pricing research you are generally capturing data from two different market segments. In many cases, you may want different offers and prices for each segment. One reason to use sorting questions in surveys is to help search for bimodal and other distributions. It is easy to see the distribution in the results to such questions.

(The question is from our current survey into Pricing Skills.)
One can then use this to separate your population into clusters and look for other properties associate with each cluster.
Of course any set of data will have a distribution and it is always important to examine this distribution carefully and look for clues to differentiation. Skew, standard deviation and shape of distribution are all possible tells, and you need to check the all.
People who want to work in the design of pricing for early-stage innovation must develop good techniques for finding insights from weak signals as conventional approaches to pricing optimization fail in such environments. This generally requires creative approaches to data analysis, a sensitivity to the details in the data and a willingness to probe, follow up and confirm what you find from more than one perspective. At Ibbaka, we often combine data from surveys, interviews, usage, CRM (customer relationship management system), CPQ (configure price quote system), marketing automation system and scrapes of public websites. We are also building tools based on our approach to pricing, that work for early-stage innovation.
